★ FeaturedArticle
Match AnalysisBeginnerSample
How to read a pitch map
What the dots on a pitch map mean, how to split lengths and lines, and the questions an analyst asks before drawing conclusions.
5 min readRead →
DATA · VIDEO · INSIGHT
Match analysis, player profiling, opposition scouting, biomechanics and the tools and templates analysts use — in one place.
What the dots on a pitch map mean, how to split lengths and lines, and the questions an analyst asks before drawing conclusions.
A simple process for scouting an opponent: collect, sort, summarise and turn it into a one-page plan the players will actually read.
A ready-to-fill sheet for each opposition batter: scoring zones, weaknesses and the bowling plan. Opens in Excel or Google Sheets.
9 resources found
 ★ FeaturedVideo
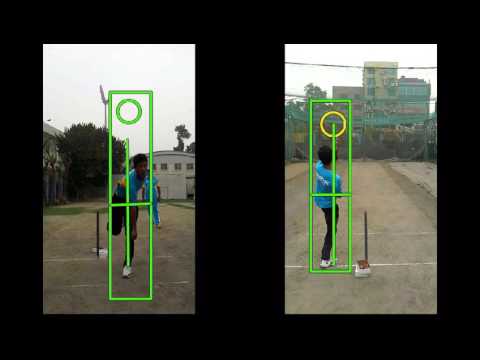
How a bowling action works, phase by phase from run-up to follow-through and what coaches and analysts look for on video to improve pace, accuracy and reduce injury risk.
A report layout that splits an innings into powerplay, middle and death overs, with space for key moments and action points.
The building blocks of a batter profile: scoring zones, dot-ball areas, dismissal patterns and match-ups by bowling type.
Camera angles and checkpoints for looking at a fast bowler’s front-foot landing on video.
How to set up a simple code window for tagging a cricket match: events, delivery types and outcomes.
The four-part structure used for case studies on this page: problem, analysis, decision and result.